Where Universities Like Yours Find Private Research Funding
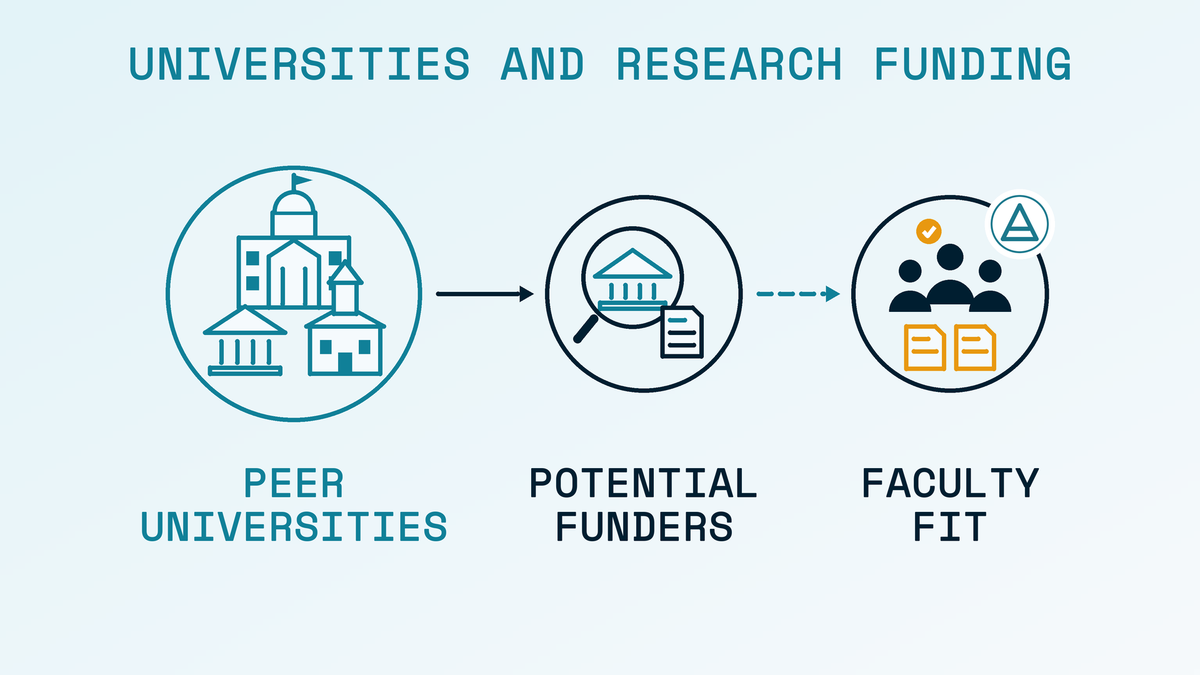
Foundations and charities list the grants they make in public tax filings, showing who supports universities similar to yours. This piece explains how research offices can use them to compare their private funding with peers, find their peers’ funders and identify the faculty to put forward.
A federal award your institution counted on has been delayed, and another has been cut. The research office is asked to find other sources of support. Private foundations and charities are one such source, and they raise two practical questions. Which of them fund research at universities like yours, and how much support could your institution realistically expect?
Most offices can name the foundations they already work with. Fewer can say which foundations support universities like theirs but have made no recent grant to them.
This piece sets out a method built on the public tables behind our report, which matches 13.9 million grant records from IRS Form 990 filings for tax years 2020 to 2024 to US colleges and universities. The worked example below applies it to one R1 university.
A benchmark against similar universities:
Every research office knows its own private grant income, but comparing that income with similar institutions is harder. Universities do not report their research grant income funder by funder in a way that allows comparison, while foundations list their grants in their annual tax returns. Reading those returns at scale makes the comparison possible.
The measure we use is private research grants received for every $100 of research spending. Across the 146 R1 universities the median is about $1.30. The range runs from under $0.40 at some campuses to more than $5.00 at others, and research spending alone does not explain the difference.
Consider one public R1 university in the Midwest. It ranks among the 50 largest R1 institutions by research spending. Its ten nearest peers each receive research grants from between 58 and 248 foundations and charities, against 39 for this university. For every $100 this university spends on research, it receives roughly $0.30 in private research grants. The median among its peers is about $1.76. At this university's research budget, that difference represents approximately $9 million a year.
The comparison says nothing about the quality of the research. It shows how much private research support an institution receives relative to institutions with similar research spending, and that is something a research office can work to change.
Why the answer is not in your own records:
A sponsored programs system records your own awards, and a foundation relations team knows the foundations your university already works with. Neither is designed to show that a foundation has made research grants to six universities with research spending like yours and none to yours, because that information sits in the foundation's filings rather than in your systems.
A grants database can assemble part of this picture, one peer at a time, given substantial analyst effort. Our tables do that reading once, across all 13.9 million grant records, and present the result in searchable form.
How the list is built:
Each R1 university's list is built in three steps, all of them already carried out in the tables.
Ten peers by research spending: Peers are the ten R1 universities closest to yours in research spending, as reported in the NCSES HERD survey, rather than by reputation or athletic conference.
Funders that supported at least three of those peers: A funder that has supported one or two of your peers may have done so for a reason particular to those campuses, such as a trustee's connection or a single commemorative gift. Support for three or more suggests a pattern of funding research at institutions like yours.
No grant to your institution: Funders already supporting your institution are set aside, so every funder on the list has no grant to your campus observed in the filings.
Your list in four steps:
The tables are open to everyone at ascendr.ai/resources/funds/, and each step below is a search or a click.
1. Check your benchmark: In the R1 exposure table (05), search for your institution. Your row shows research_grants_per_100_usd_rd, your private research grants per $100 of research spending, and research_funders, the number of funders supporting your research. To see your peers, clear the search and click the heading herd_total_rd_usd_avg_fy2023_2024. The ten institutions nearest to yours in that column are your peers.
2. Open your funder list: In the prospect leads table (08), search for your institution and the list is already built. Each row is one funder, with peers_funded_of_10, the number of your peers it has supported, and research_paid_to_peers_usd, the research grants it paid to them between 2020 and 2024.
3. Put the strongest prospects first: Click the heading peers_funded_of_10 to sort by the number of peers each funder has supported, or research_paid_to_peers_usd to sort by the amount paid.
4. See how each funder accepts proposals: The last column, preselected_only, comes from each private foundation's latest tax return. "Yes" means the foundation states that it gives only to organisations it selects, and "Not stated" means the return does not say so. Public charities file a form that does not ask, so they show "n/a (Form 990 filer)".
The prospect leads table covers the 146 R1 universities. Institutions outside that group can find their own figures in the institutions table (04).
A worked example:
For the example university, the prospect leads table lists 51 funders. Each has supported at least three of its ten peers, and the filings show no research grant from it to the university itself. Not every one of them suits the university's research.
Peers are chosen by research spending rather than by field. Most of the 10 peers have a medical school, and the example university does not. We reviewed each of the 51 funders against the subjects the example university researches. 28 of them fund research it does not carry out, most of them medical research charities such as cancer and diabetes foundations, so we removed them from the list. The remaining 23 fund research in fields where the example university is active, and the ten largest are shown below.
| Funder | Peers supported (of 10) | Research grants to those peers, 2020 to 2024 | Accepts proposals | Fields it fits |
| Gordon and Betty Moore Foundation | 4 | $24.1M | By invitation | Physics, chemistry, biological sciences |
| Alfred P. Sloan Foundation | 10 | $12.0M | No restriction stated | Engineering, computing, economics, energy |
| Laura and John Arnold Foundation | 5 | $12.0M | By invitation | Criminal justice, education, public finance |
| Good Ventures Foundation | 3 | $3.8M | By invitation | Animal welfare, AI, biosecurity |
| William and Flora Hewlett Foundation | 4 | $2.7M | No restriction stated | Education, climate, economy |
| Arnold and Mabel Beckman Foundation | 5 | $2.4M | No restriction stated | Chemistry, life sciences, early career |
| AKC Canine Health Foundation | 4 | $2.1M | Public charity | Veterinary medicine |
| Whitehall Foundation | 4 | $1.3M | No restriction stated | Basic neurobiology |
| Foundation to Promote Open Society | 5 | $1.3M | By invitation | Policy, social science |
| National Council for Air and Stream Improvement | 3 | $1.0M | Public charity | Environmental science, air and water quality |
13 more follow, among them the Ford Foundation, Research Corporation for Science Advancement, the Social Science Research Council and the Sustainable Forestry Initiative. Together the 23 funders made more than $65 million in research grants to the example university's peers over five years. One of them, the Sloan Foundation, has supported all 10.
What the list can and cannot tell you:
A list of this kind is a starting point. These are the limits we place on our own report.
- "No grant observed" does not mean "no relationship". A funder may have supported the institution through a channel the filings do not capture, or before 2020.
- Institution-level figures are estimates from public filings. Any figure should be checked against institutional records before it is quoted.
- Peers are matched on research spending, not on field, so some funders on a list will not fit your institution's research.
- A funder active at peer institutions is not a stronger prospect than one already active at your own. Existing relationships come first.
- Appearing on the list implies nothing about eligibility or an open application route. Some of these funders give only to organisations they select.
From a list of funders to the right faculty:
A list of private funders answers the first question. The next two are whether a foundation or charity on that list is accepting proposals now, and which faculty member to put forward.
On a campus with more than a thousand faculty, the answer to the second is spread across departments and often held in memory.
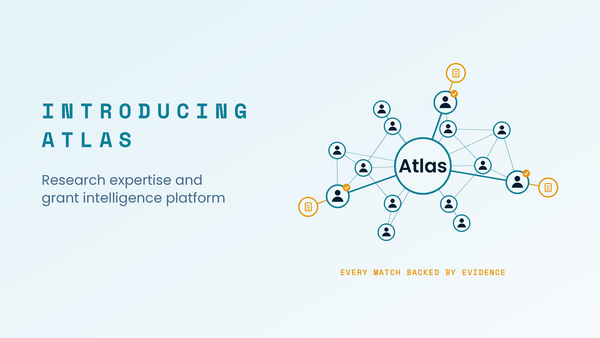
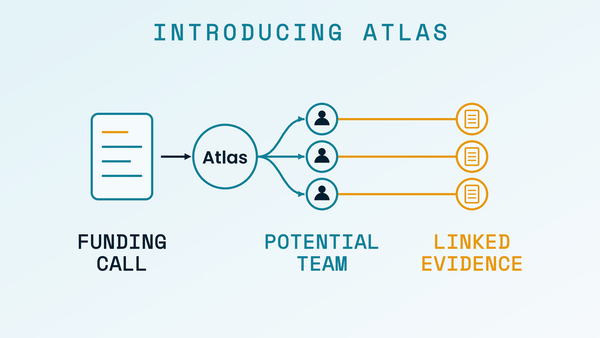
This is the step Atlas was built for: Some private funders on your list publish calls for proposals, and some give only to organisations they select. Atlas helps with both.
- Funders that publish calls for proposals: Opportunity matching in Atlas lists active and upcoming calls from foundations and charities, alongside federal calls, with the amount and closing date where published, and each call's relevance to your institution. Search for a funder from your list and, if it has a call listed, select it. Atlas reads the call, lists the expertise it requires and shows the faculty who fit, with the grants, publications and patents behind each name.
- Funders that give by invitation: Some give only to organisations they select and do not accept unsolicited proposals, including several in the table above. Paste the funder's program description into Atlas, and it returns the faculty whose work matches the program. This gives your research office the evidence needed to request an introduction.
Opportunity matching can widen the search as well. In the agency filter, select "Non-federal" to show only calls from foundations and charities, then sort by "Relevance". The private calls that best fit your institution's research appear first, including calls from funders not yet on your list.
In each case, the result is a short list of faculty, with the grants, publications and patents that support each recommendation. Scores and depth assessments are labelled as estimates, and your research office makes the final decision on whom to put forward.
Bring one funder from your list and we will show you, in a short session, which of your faculty fit its program and the evidence behind each name. Request a demonstration at ascendr.ai/request-demo.
Written by the Ascendr Team
Ascendr, PBC is a Delaware public benefit corporation based in Mount Airy, Maryland. We develop decision intelligence for research, intellectual property, and technology strategy. Our public benefit mission also includes advancing education and entrepreneurship in communities worldwide.